Diagram style

Diagrams

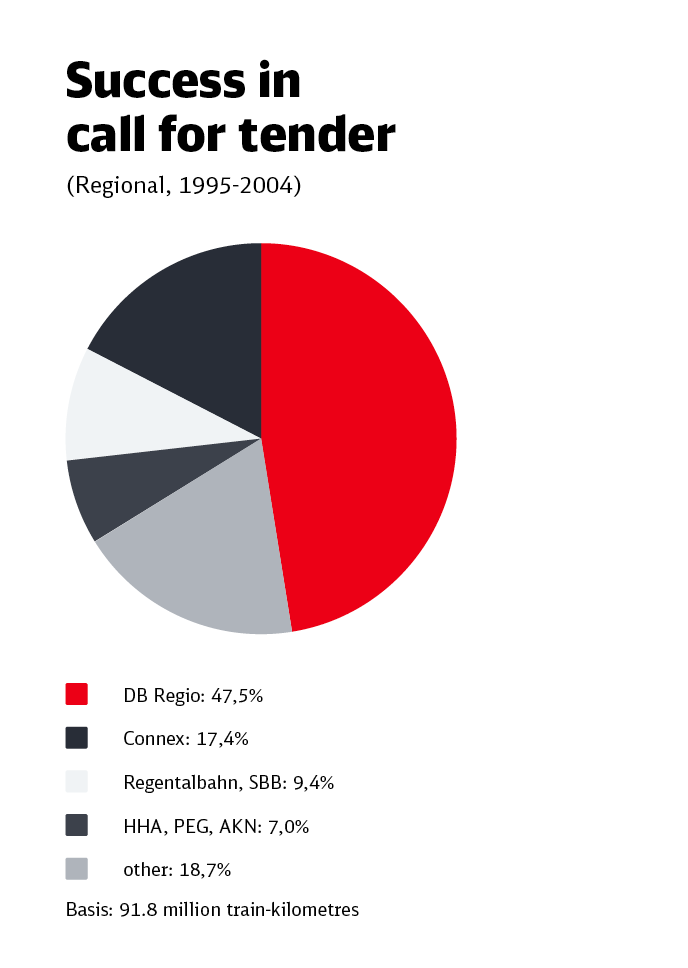
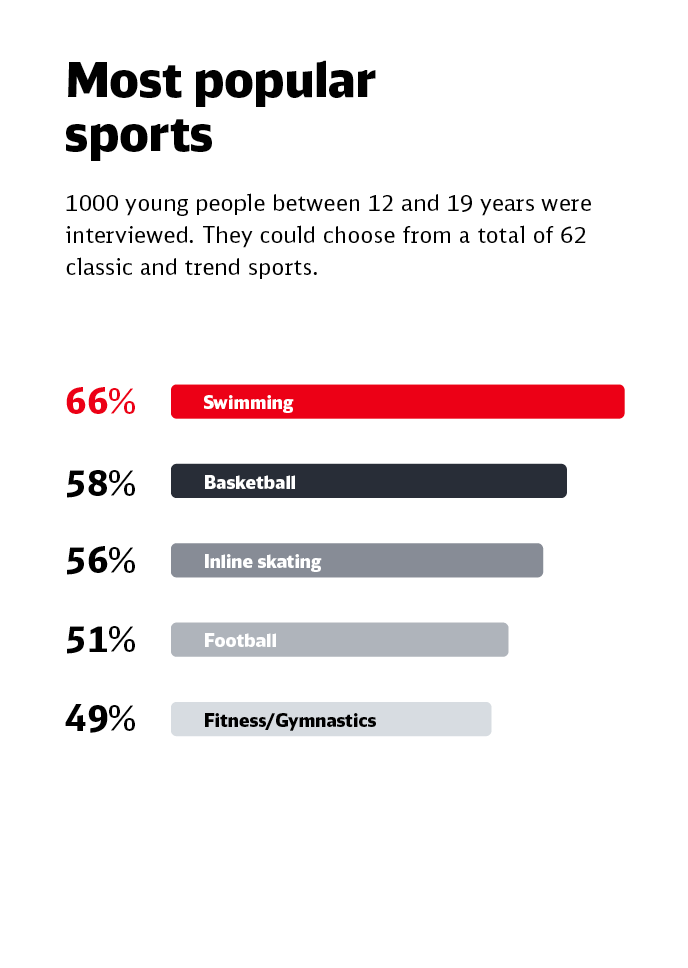
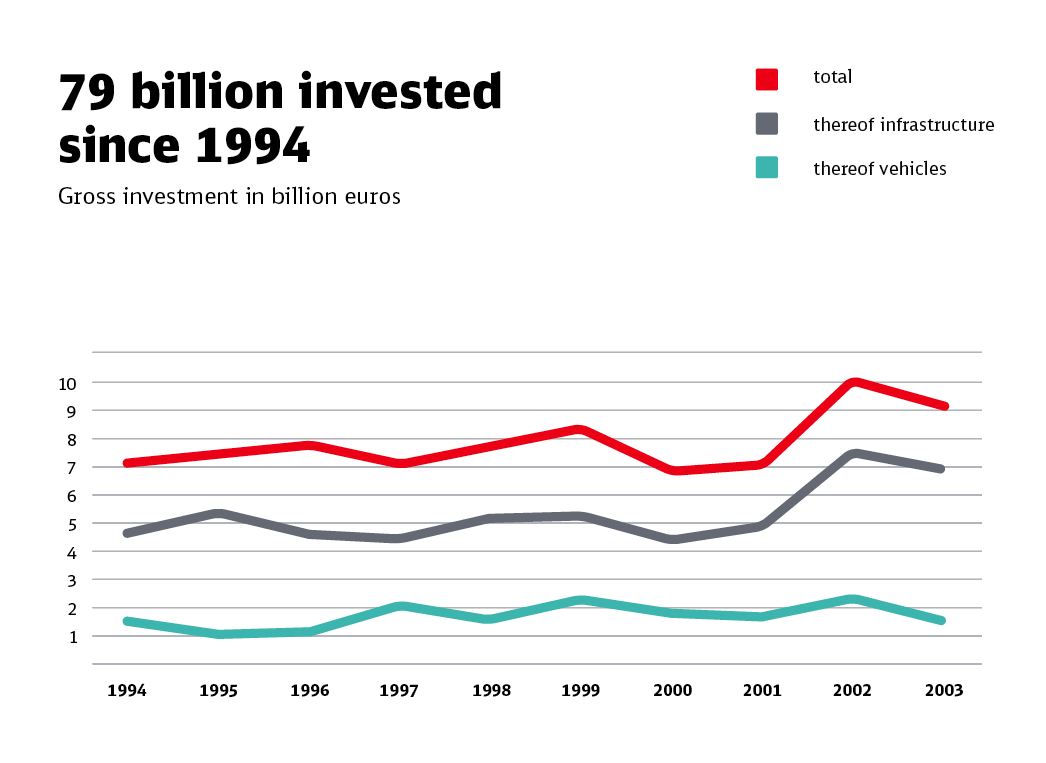
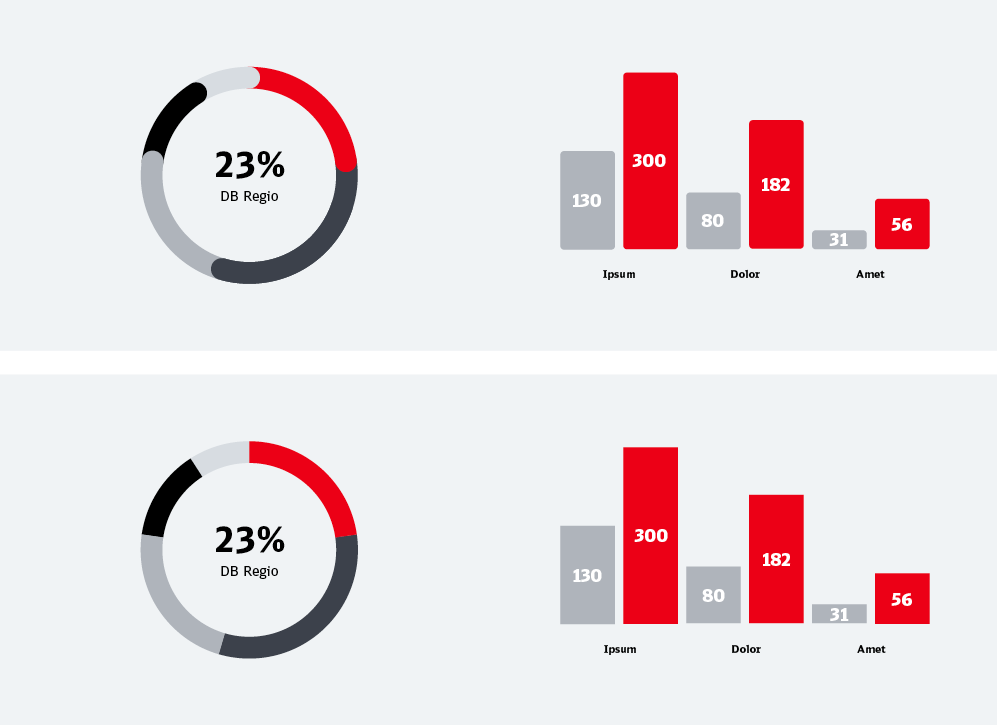
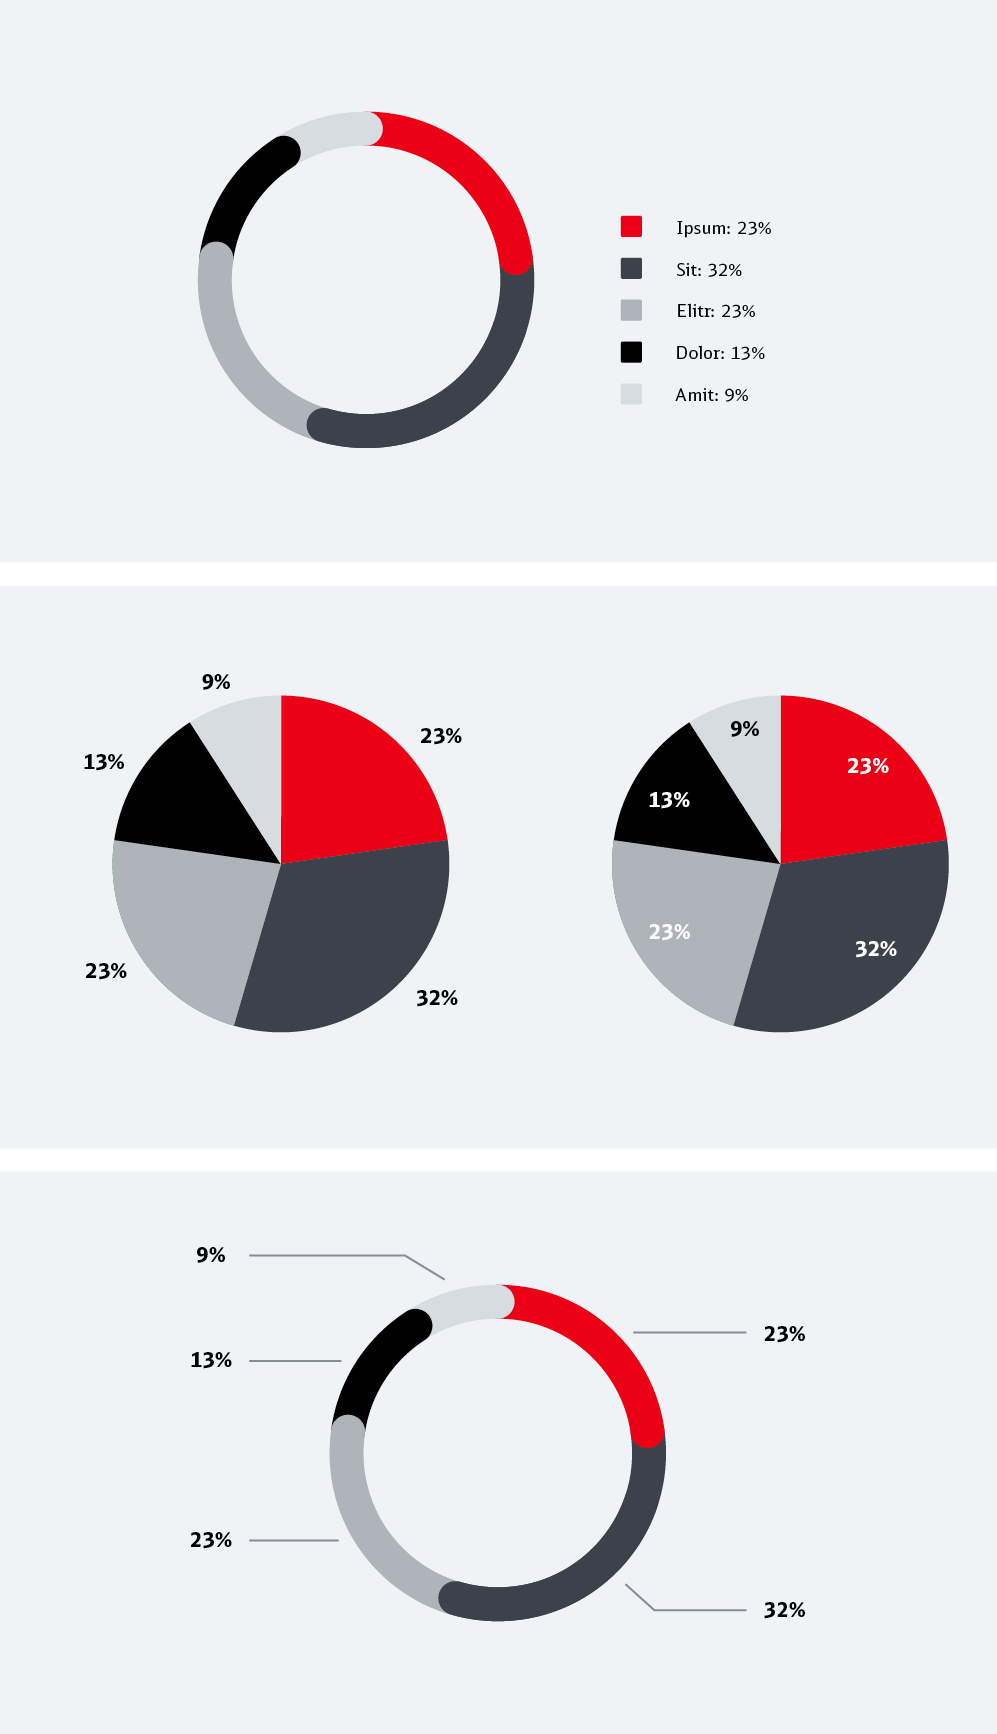
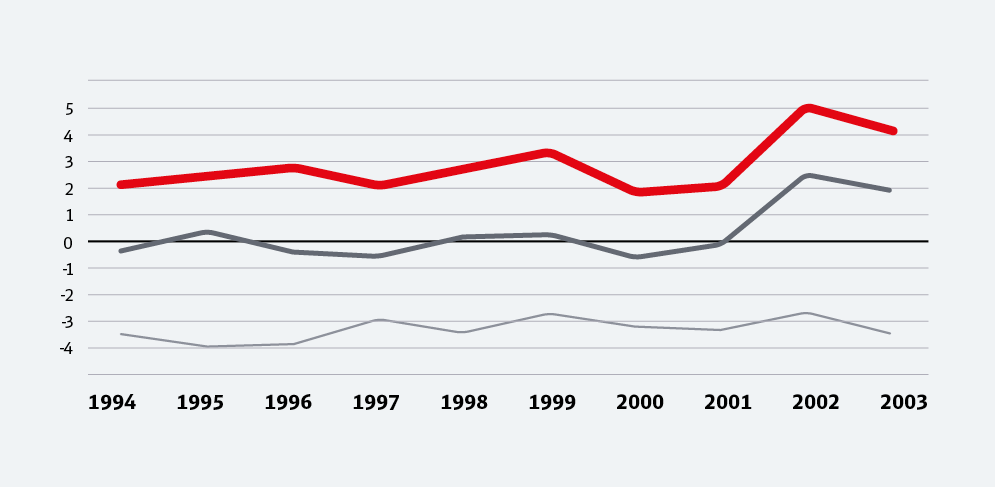
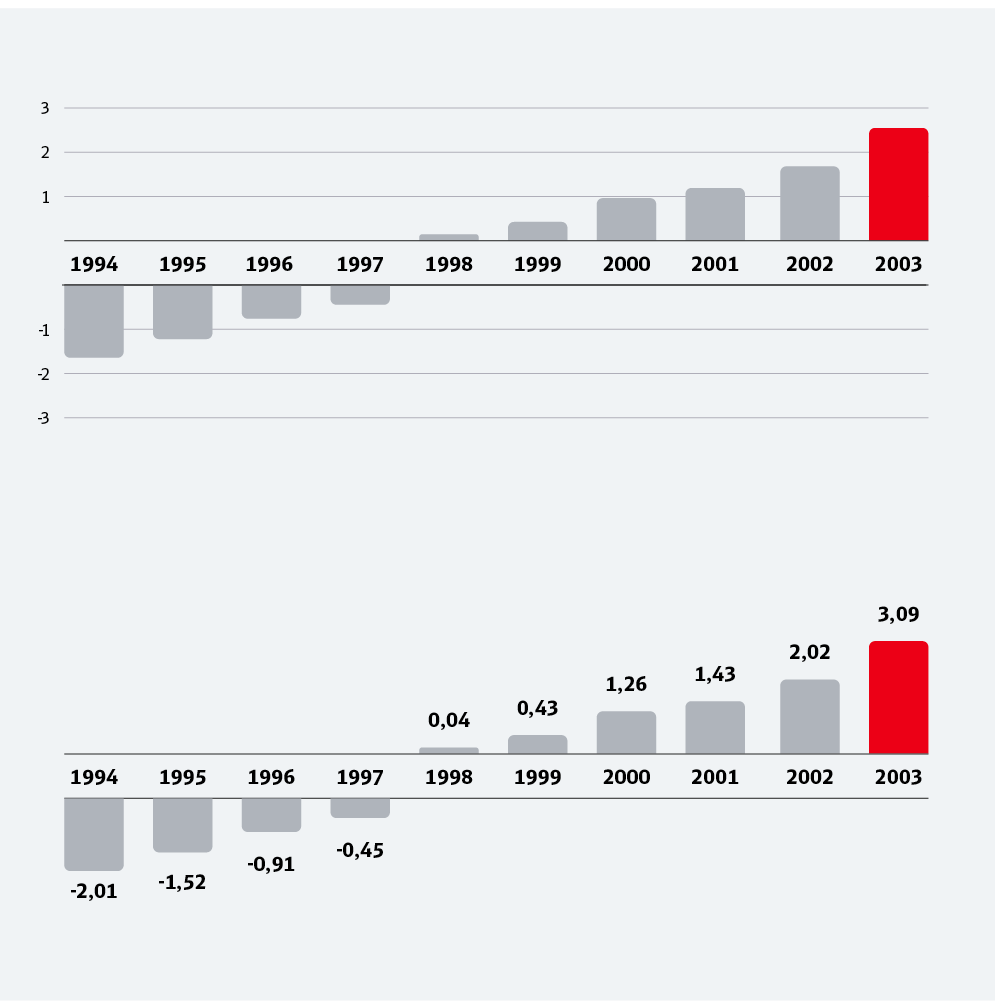
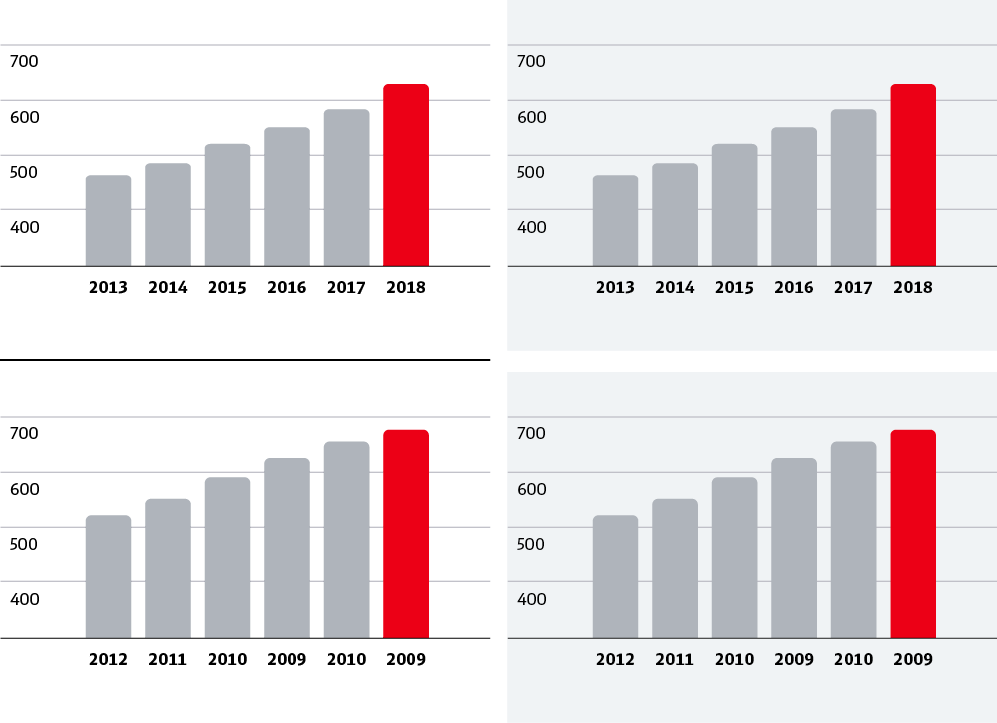
In order to graphically represent the proportions of quantities, there are different types of diagrams available. Common to all of them is the use of a uniform design language and uniform graphic means within the framework of the corporate design. In the sense of a clear and precise representation, decorative elements are avoided and a two-dimensional impression is preferred. 

Application examples

Bild_1

Bild_2

Bild_3

Bild_4

Bild_5

Style of diagrams

Design language
In order to ensure a clear and quick transfer of information, simple basic geometric shapes without line frames are used. The brand‘s typical features are flat graphics with rounded corners and line endings. Exceptions to this are applications such as PowerPoint, which for technical reasons do not allow the automated generation of diagrams with rounded corners. 

Bild_1

Lettering
The labeling can be done via a legend as well as directly in or on elements. The legend can be placed freely and should be set uniformly within a medium.

In addition, marking via lines is possible. The lines touch the area elements and extend to the edge of the graphic. They run completely or partially horizontally.

The diagram labeling is black, highlights are bold and/or DB red. Further differentiation can be achieved by using grey text or a second font size (e.g. for scale labels).

Bild_2

Lines
Normally all lines have the same thickness (except the value lines in the line chart). However, if you need to differentiate, you can use a second line thickness. You can also work with dashed or dotted lines.

The line color is black or Cool Gray 400 on light backgrounds or white on dark backgrounds. Highlighting is achieved with DB Red. 

Bild_3

Scale lines
Scale lines are in the background. Depending on the chart type, only horizontal or vertical scale lines are usually used. The numbers are arranged below or in the middle of the respective line on the left. On white, the scale lines are Cool Gray 400 and the base line is black.

If exact values are assigned to the columns or bars, scale lines are not necessary. 

Bild_4

Delimitation
Diagrams can be delimited by lines or area modules.

Bild_5

Colour of diagrams 

The area elements of a diagram are kept in the defined grey tones. DB Red is used as the color for marking. If there is a need for differentiation using chromatic colors, the secondary colors are used.

Bild_1

Linear gradations
Linear color gradations are mostly used for less complex diagrams. Often only a certain part of these diagrams is highlighted separately. 

Bild_2

High contrast gradations
To achieve the highest possible contrast and the best possible differentiation of the individual parts of a diagram, the use of high-contrast colour gradations is recommended.

Bild_3

Special application

3D Effects
Provided that it is professionally produced, it is also permitted to work with a 3D impression, e.g. with shadows or implied spatial depth. 

Bild_1